
Salt Tracker
Overview
Salt tracker is a tool to track daily salt intake. It also provides salt insight to help make better grocery shopping decisions. It makes staying on a less salty diet effortless!
Duration
May 2021 - Sep 2021
Category
UX Design
UI Design
Service Design
UX tools
User Journey Map
Usability Testing
Design Iteration
Introducing Salt Tracker
Healthy Salting.
Simplified.

Log salt intake
Intuitive and fun
Track for
the whole family
dashboard for all family members

Quick access
to every meal
do not miss a single meal

Statistic
and log history
Information made easy

BACKGROUND-THE DISCOVERY
Eating too much salt is killing 2.5 million people every year
Salt overtake has become a global health challenge. On average, Americans eat more than 3,400 milligrams of sodium each day, more than two times the American Heart Organization has recommended (1,500 mg). Children are also consuming salt far more than they should.
An estimated 2.5 million deaths could be prevented each year if global salt consumption were reduced to the recommended level.
— World Health Organization
⬇
How Might We
“help users to track and control salt intake
thus forming a healthy salt-reduced diet?”
Research
Understanding the problem
Where is salt intake from?
77% of American salt intake comes from processed food, which includes bread, pizza, cold cuts and bacon, cheese, soups, fast foods, and prepared dinners, such as pasta, meat, and egg dishes. Only 18% comes from the table.
Can humans resist the taste of sodium?
Luckily, the answer is yes. Unlike sugar, humans have to learn to love salt. In just 3 months, we can reverse our craving for salt in a somewhat painless way.

Why is reading nutrition labels important and how to read them?
Since 77% of salt comes from packaged food, it is important to read and compare nutrition fact labels. Actually, multiple health organizations including American Heart Organization consider this as an effective way to salt smartly.

⬇
“Reading and comparing nutrition labels
is the key to solving this problem”
SURVEY- QUANTITIVE RESEARCH
People think they are salt smart, which isn’t the case
What are people’s takes and behaviors on salt reduction?
In order to understand this question from a quantitive perspective, I conducted a survey through survey monkey. This survey has 72 participants; most of them are young aged and have a high degree.

INTERVIEW- QUALITATIVE RESEARCH
Family plays an important role in our lifelong cravings for salt
I conducted 4 one-on-one in-depth interviews with 1 working mom, 3 unmarried people. Because of the importance of a salt-reduced healthy diet for a kid, I decided to interview a parent who cooks for the kid. The working mom I talked with is 39 years old. She has a lovely 3-year-old daughter. She told me she was extremely health-conscious when preparing food for the whole family, especially for her daughter. And she is the only one I talked with that really read the nutrition facts and would compare sodium index between equivalent food.

All of the other 3 interviewees are young and they are either students or in their early careers. Here are the key questions I asked them and their answers.

⬇
Key takeaways from the research

HUGE COGNITION GAP
85% of people believe their salt intake is at the recommended level, while the actual amount is twice that.

FAMILY IMPACT
Family plays an important role in our cravings for salt. Our taste and eating habits would not change much even if we move out.

FOOD INSIGHTS FOR GROCERY SHOPPING
The food we choose to buy during grocery shopping is important: bread, bacon, sausage, soy sauce, etc. How might we make comparing nutrition labels effortless?
THE IDEATION
How I came up with 5 key features
Persona & User Journey Map
From research especially interviews, I was able to generalize a typical user and a journey that this user would go through during the whole process. A typical user would be a mom cooking for the whole family. By scrutinizing the journey the user takes, I was trying to unveil their doing, thinking, and feeling to identify specific design opportunities.

Based on opportunities extracted from the user journey map, I focus my design mainly on the following 5 features: easy-to-access food information, low salt recipe, dashboard for the whole family, statistics visualization, and making tracking a habit.
⬇
5 features to focus on
“1. easy-to-access food insights
2. low salt recipe
3. dashboard for the whole family
4. statistics visualization
5. making tracking a habit”
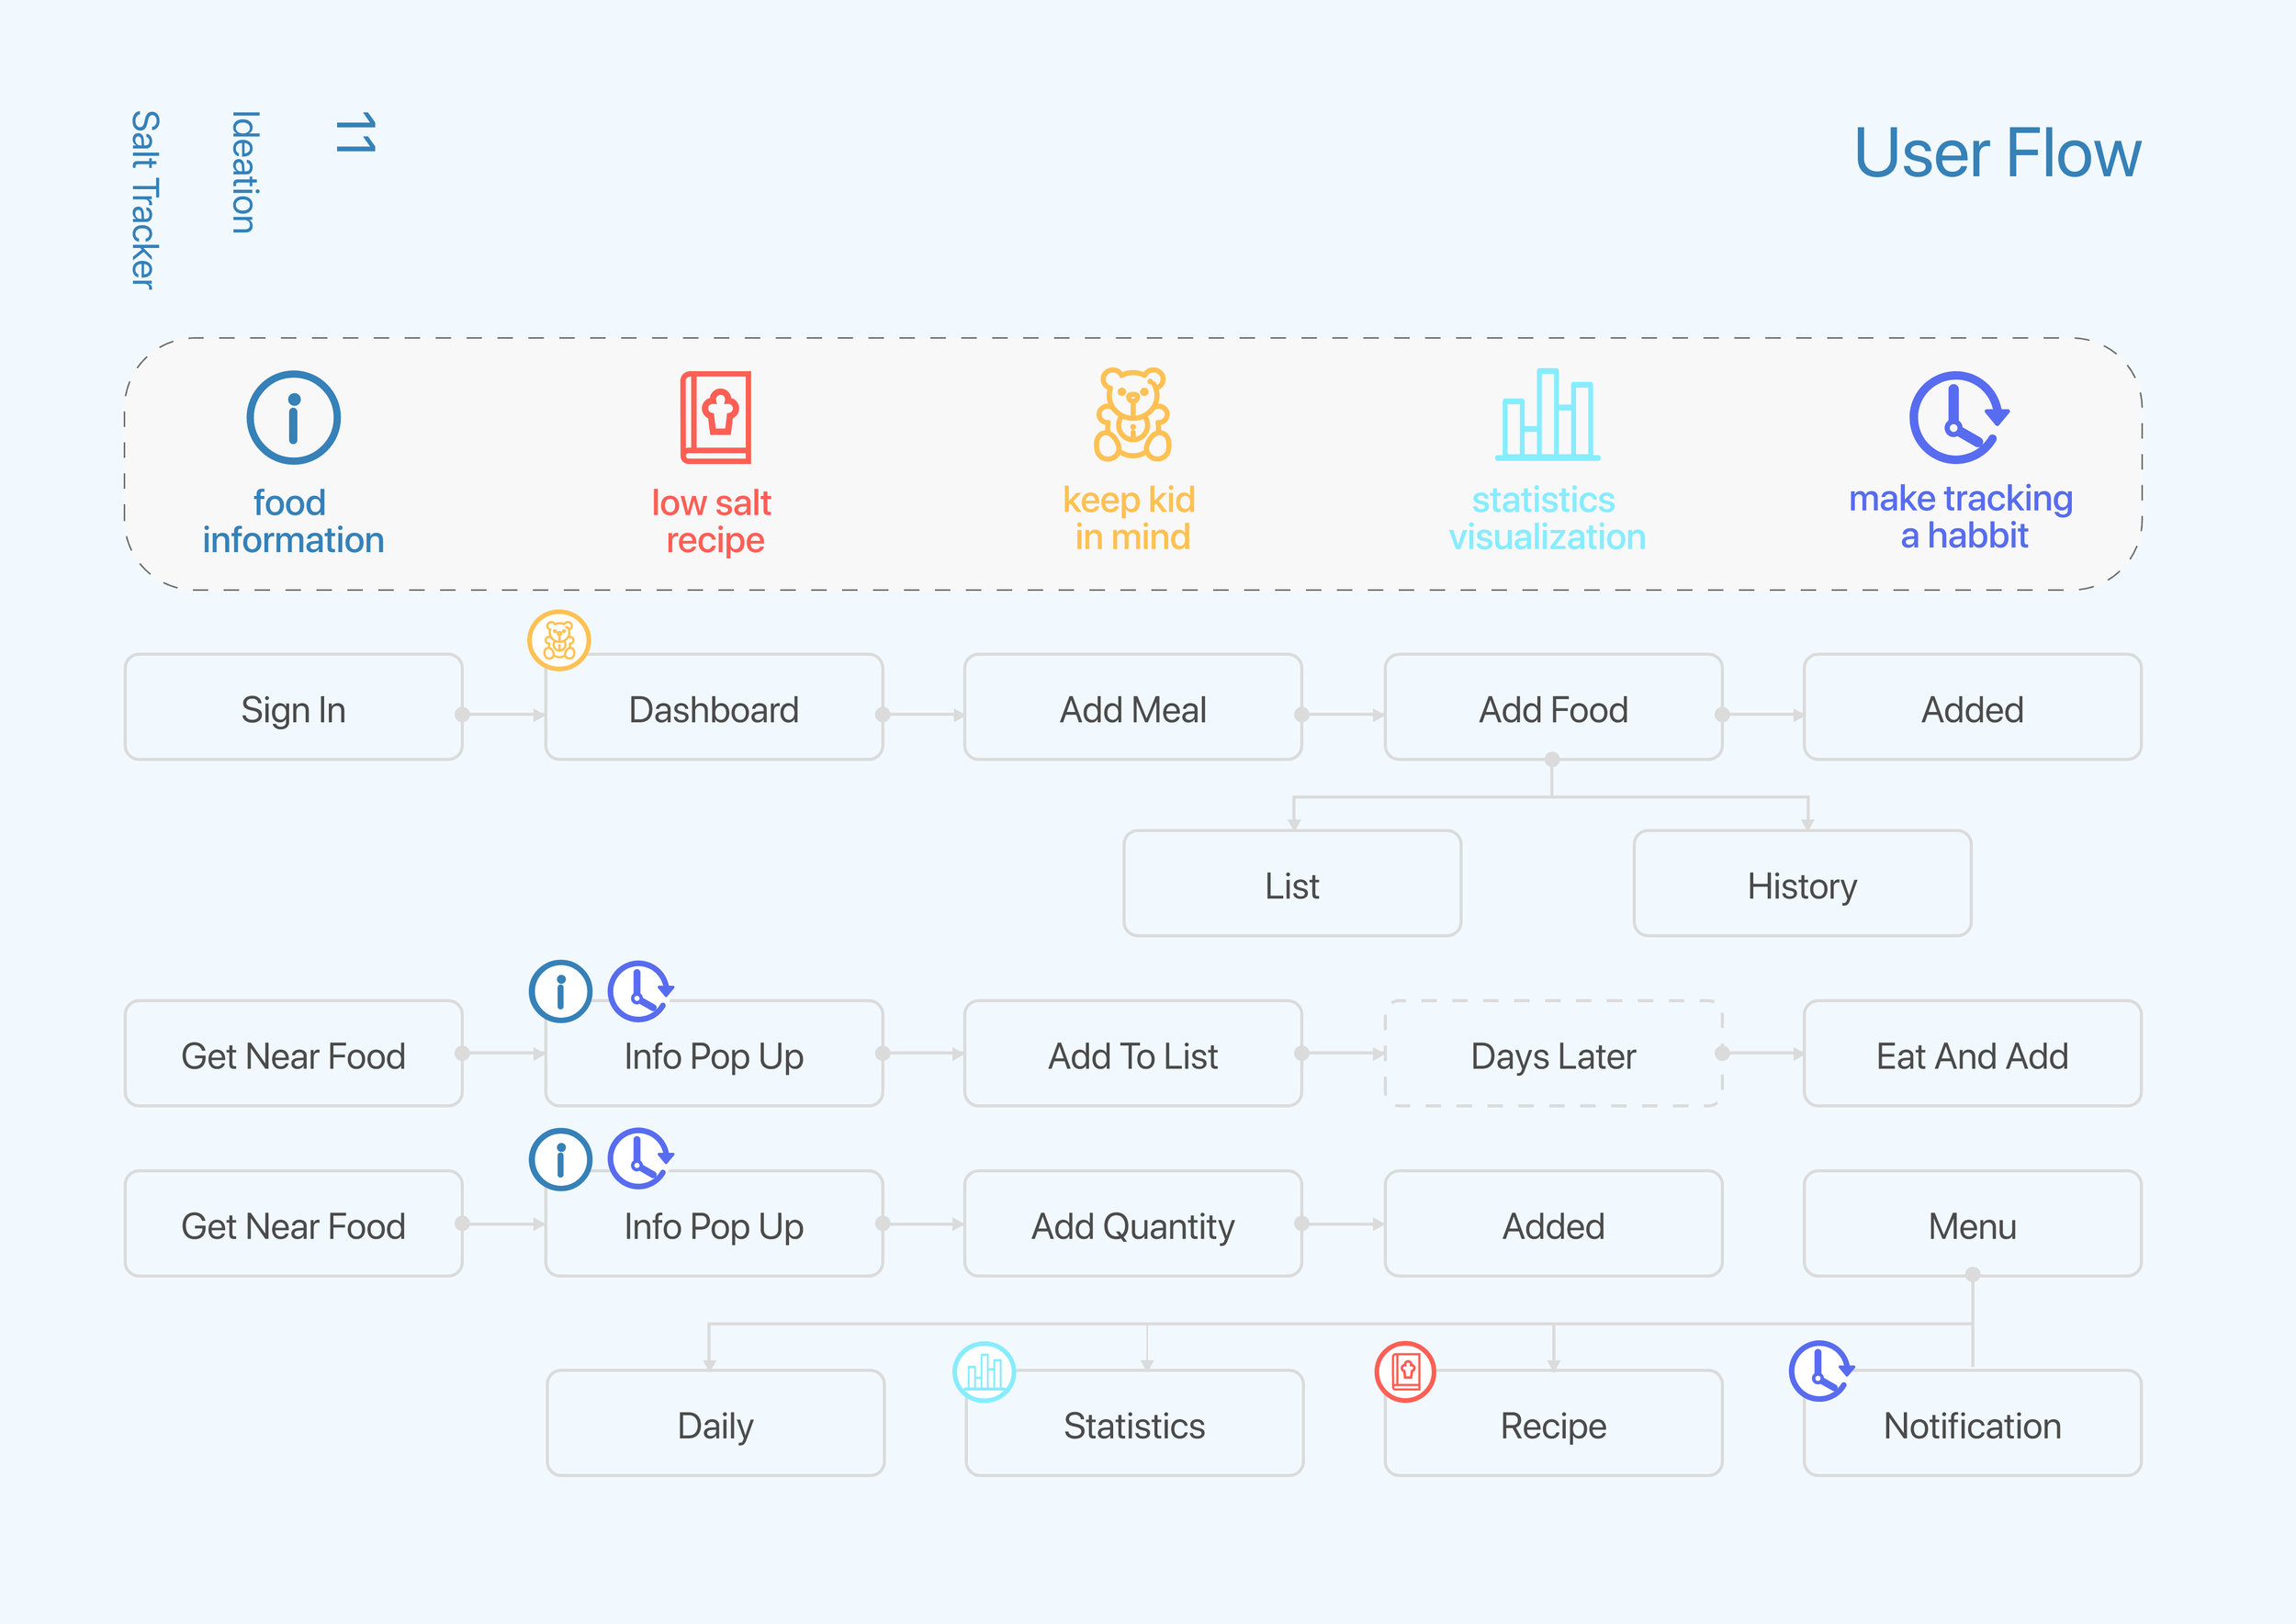
User Flow
An app is a perfect option for matching those 5 design focuses listed above. So I decided to design an app to address this problem. Here is the user flow when using app as well as some key features of this app. As the picture shows, every focus is presented by a symbol. A specific procedure marked by these symbols means it can solve this issue or achieve this goal.
Wireframing


Usability Testing & quick iteration
In order to make my final design as valid as possible, I conducted a few usability testing with volunteers. Luckily, my first version of the wireframe was considered effective and easy to understand. Still, there are a few small bugs that need to fix. So I made some small changes and iterated a little bit.

THE FINAL DESIGN- PROTOTYPE
Integrating 5 features into 4 tabs
In this app, I designed 4 main pages as indicated in the navigation bar: daily, stat (statistics), recipe, and profile. Besides, I saw logging salt intake for every meal or snack as the most important part of this app. It should be quick and accessible. Thus I designed the main button overlapping the navigation bar which users can access on all 4 pages. Also, it is designed as a call to action (CTA) button to help form the logging and tracking habit.
Daily: this is the dashboard page for showing current salt intake. Data is designed to be intuitive and understandable. The salt shake and salt “mountain” indicate how much salt left you can consume today and how much salt you’ve already consumed respectively. Users can also log a specific meal such as lunch in only one step.
Stat: the design goal of this page lies in two ways. One is designing an understandable-in-a-glance chart. To achieve this, I chose a bar chart for a better comparison between days and 4 colors to represent 4 meals. In this way, users can have a better sense of what they consume and encourage a more favorable action. The second is to make every log of salt intake easy to see, find and edit. I used a triangle bar to showcase every log which contains essential information such as time, salt quantity, and type of meal.
Recipe: this page is relatively simple. Simply keeping it easy to navigate will be fine.
log salt intake: the key is to allow users to complete this action step by step so they don’t get overwhelmed. I used animations to make those steps more coherent and responsive. Once the log is finished, another animation in which the salt shake shakes and salt drops will be shown to the user.

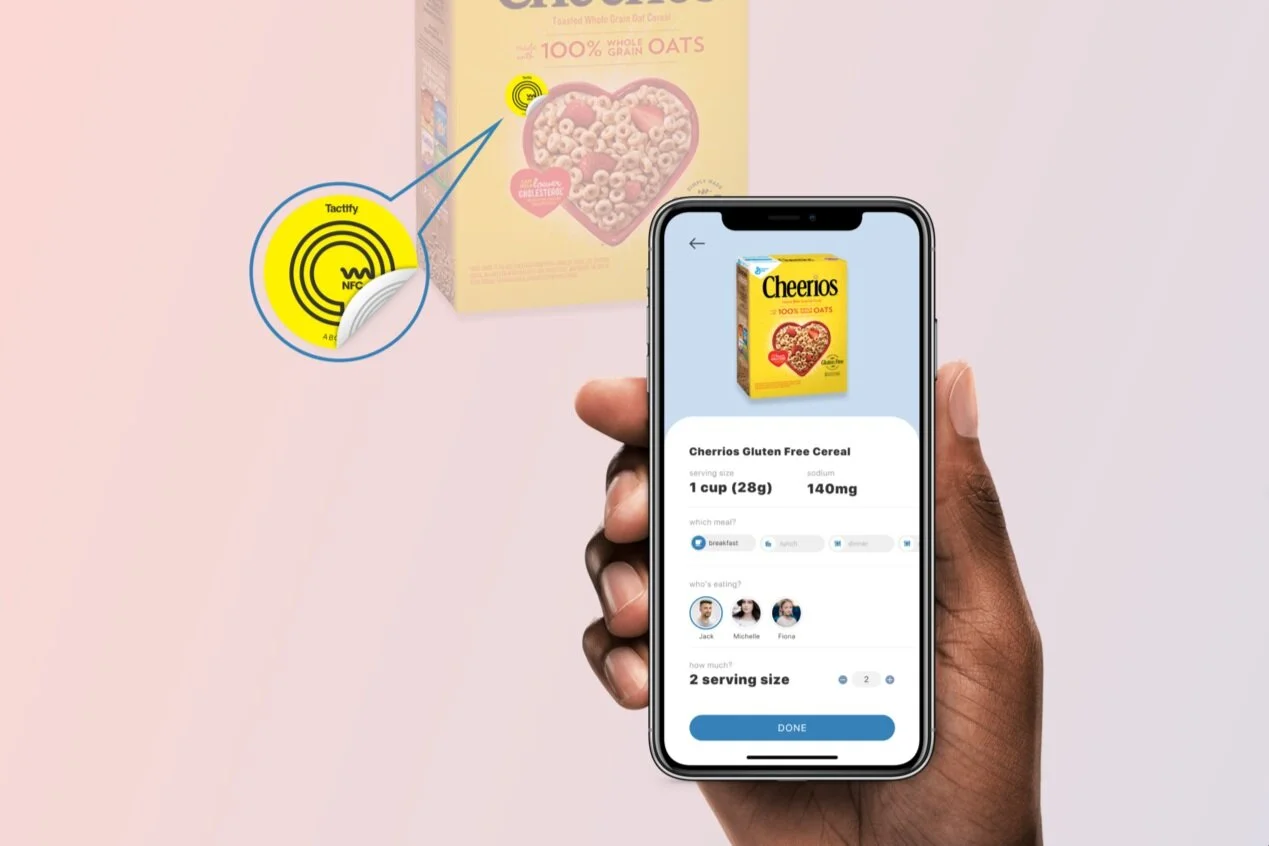
Tap to get salt insight when you are shopping grocery
NFC tag is cheap and easy to get. Thus, we propose that every food company should stick one to every product they make, just like the nutrition label. It should be a must-have. By having NFC, users can view nutrition facts about the food in just a single tap. We also provide the user with food insights such as is it low-salt and healthy.
